Austin Milne, Senior Product Designer

From complex problems to measurable impact.

For 8+ years, I’ve turned product challenges into intuitive, effective experiences. From making AI insights easier to trust to simplifying data connections and improving conversion, I focus on solving the right problems and measuring the impact.

See selected work
Flight log

Selected work, five stops.

Stop 01AgencyAnalytics (B2B SaaS)

AI benchmarking, forecasting & anomaly detection

Agencies could see what had happened. They couldn’t see how they compared, where a metric was heading, or when something unusual was happening. So I designed the features that answered all three, and the way customers find them.

Senior product designer. Owned the end-to-end experience across research, workshops, design, prototyping, and launch.
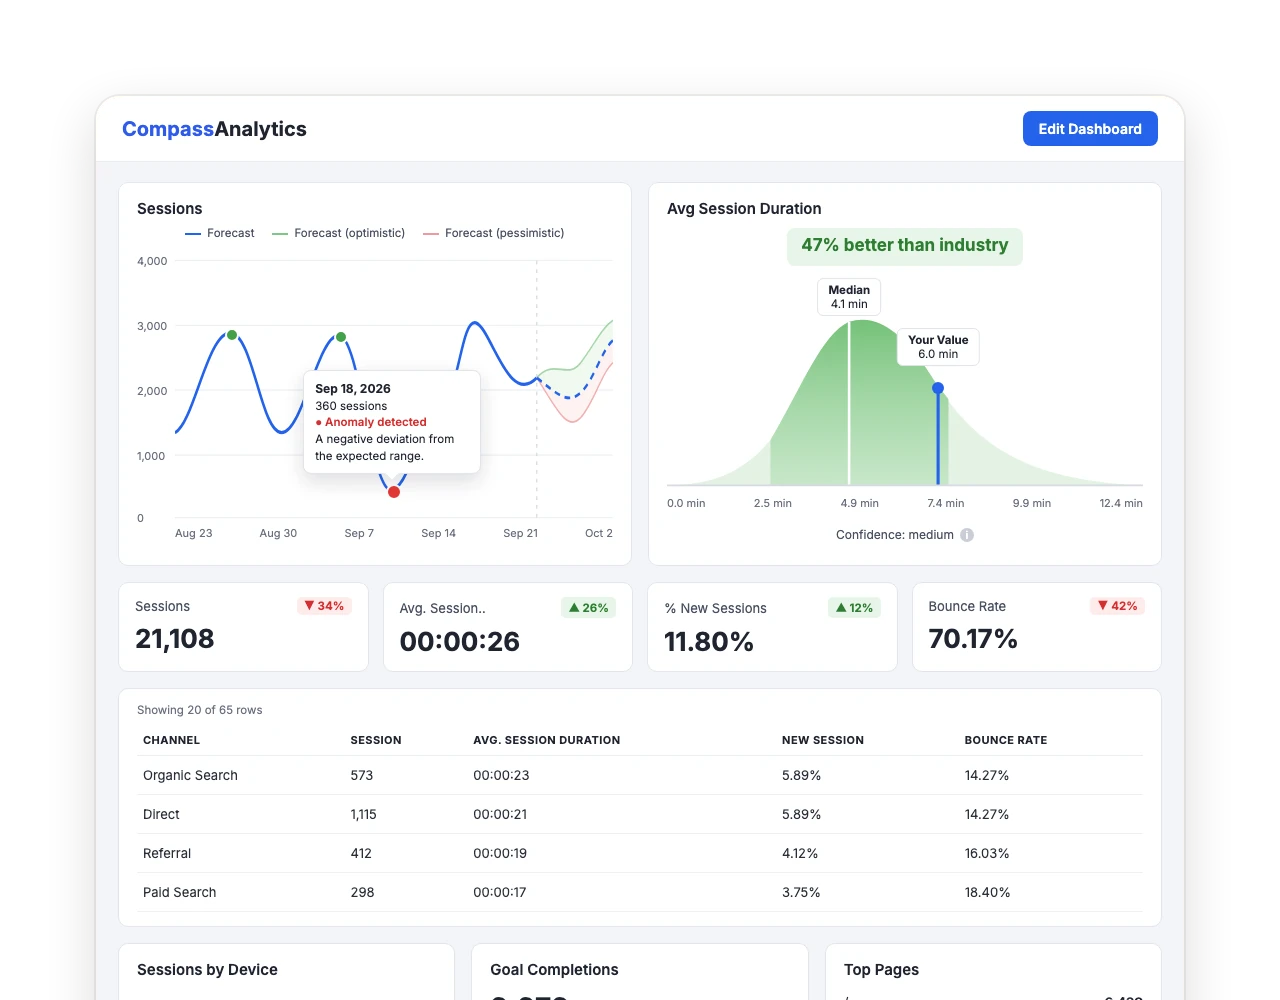
An AgencyAnalytics dashboard: a Sessions chart with a forecast range and an anomaly, next to an industry benchmark reading 47% better than industry.
Avg Session Duration (Benchmark) 47% better than industry Confidence: Medium Data used is detailed, but not fully comprehensive. Results can be interpreted with some confidence.
+12%
increase in plan upgrades, driven by the new AI capabilities and upgrade paths
30%
less time spent analyzing data, as reported by pilot users

Three capabilities, one principle: an AI insight is only useful if people know how much to trust it. Confidence labels, forecast ranges, and knowing when not to show a result were as much a part of the design as the charts.
Stop 02AgencyAnalytics (B2B SaaS)

Onboarding that shows the value

Trial users weren’t connecting data, so dashboards stayed empty and the product never proved itself. A run of tested experiments, ending with a Smart Dashboard, changed that.

+92%
activation, from 9.3% to 17.9%, alongside a 25.5% lift in trial-to-paid conversion

Time to activation: 5.3 days, down to 1.2 days

Senior product designer. Led design across the experiments, from funnel mapping and segmentation to prototypes, documentation, and launch.

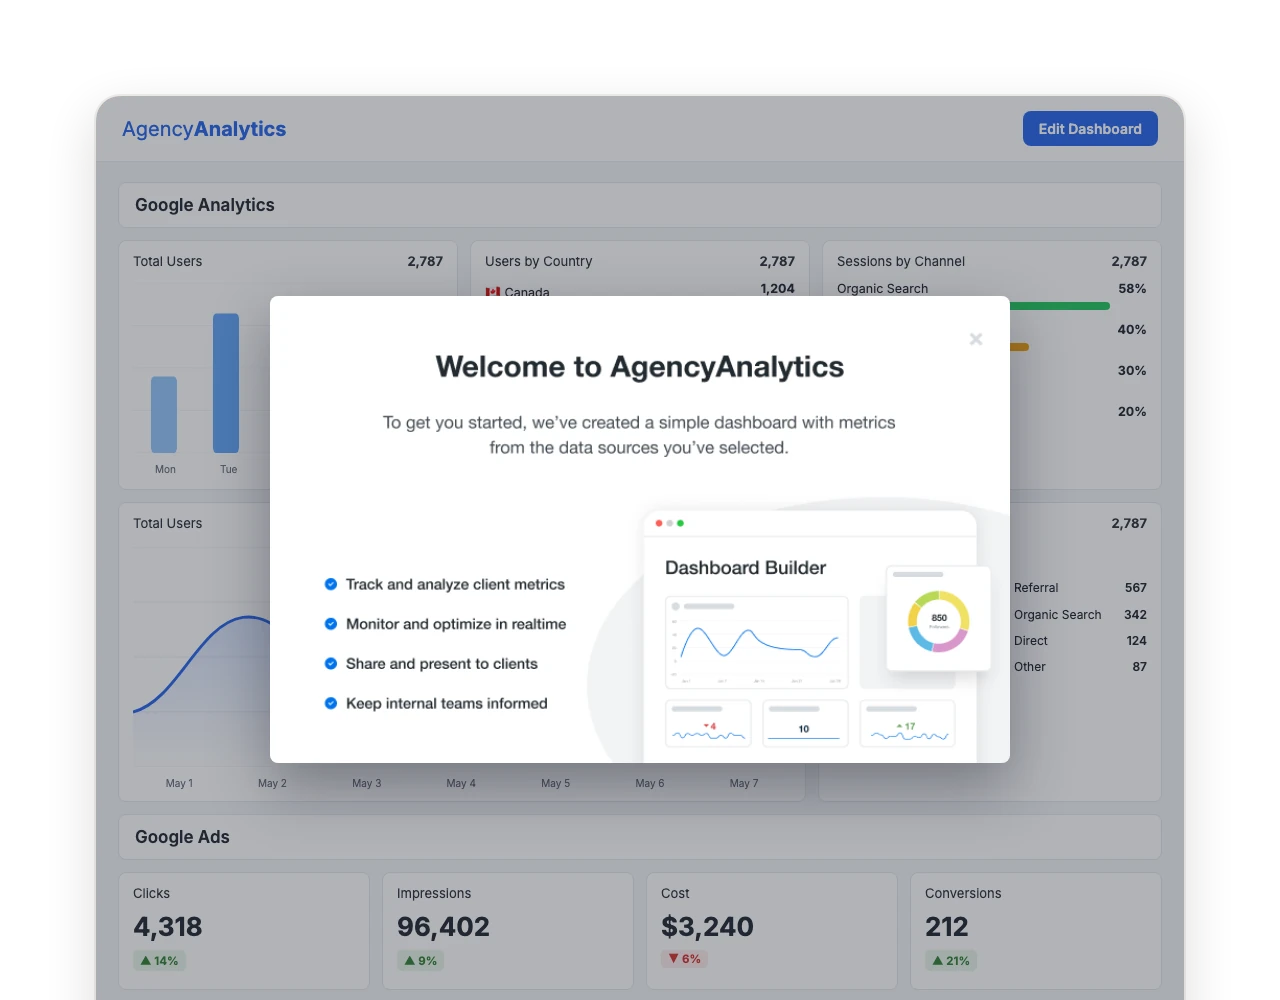
The Smart Dashboard: a welcome modal over a dashboard populated with demo widgets.
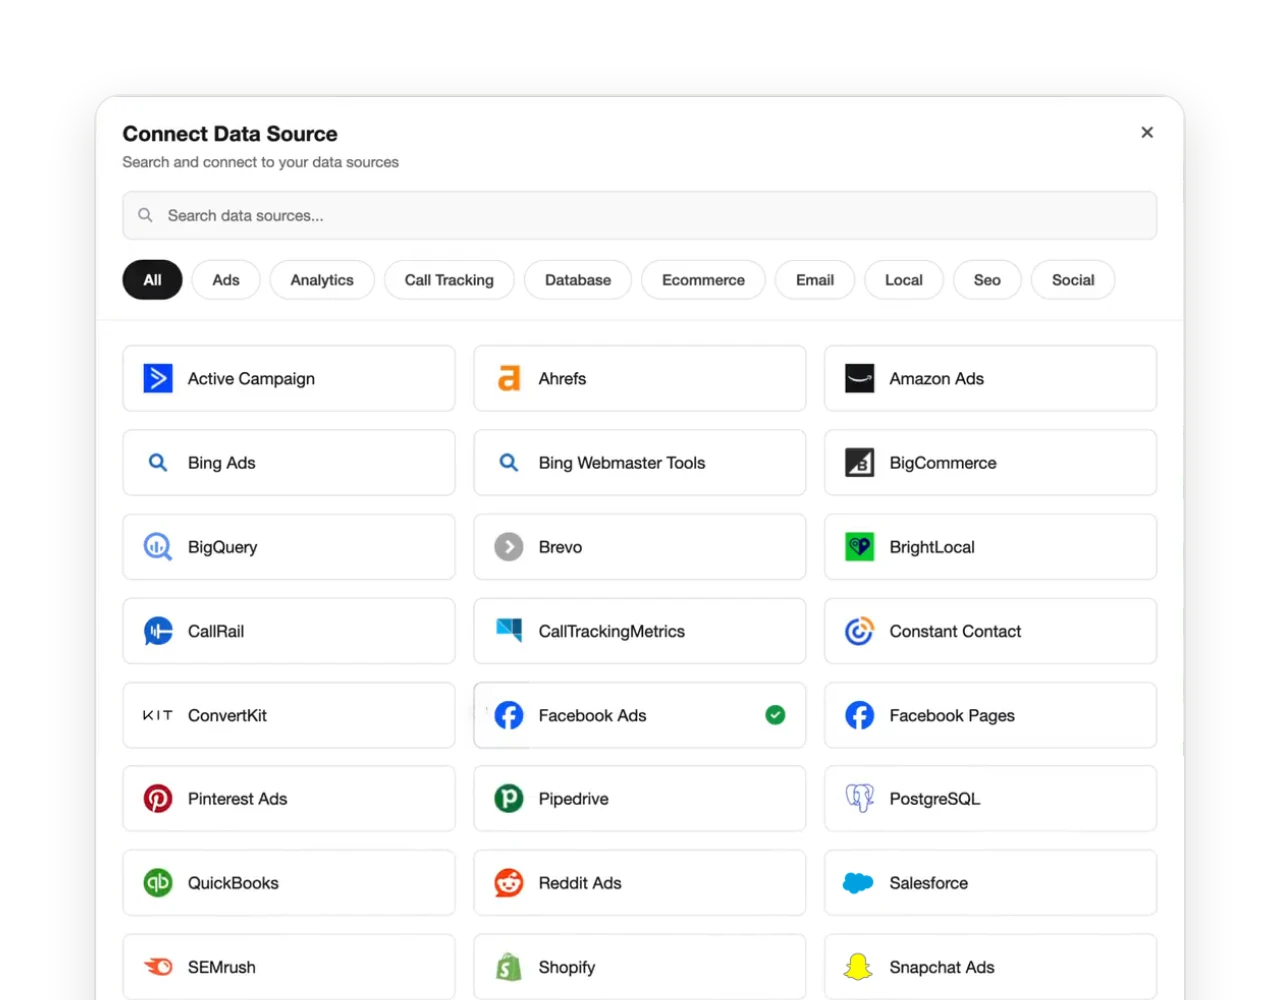
Which data sources do you use?
ClicksDemo data4,318Connect Google Ads
The redesigned Connect Data Source modal with search and category filters.
Select accounts to connectConnect 3 accounts
MAIN ACCOUNT SUBACCOUNT SUBACCOUNT SUBACCOUNT CLIENT CLIENT CLIENT
The relationship users couldn’t see. The redesign made it visible.
Stop 03AgencyAnalytics (B2B SaaS)

Making a hidden data model visible

Data connections are the foundation of every report, and one of the most complained-about areas in NPS feedback. I audited the whole app, then made the account-to-client relationship something people could actually see.

↓80%
less time to connect, by selecting every account in one pass instead of one by one

Senior product designer. Owned discovery through ship: ticket analysis, a full-app audit, AI-powered prototypes, and phased delivery with engineering.

Stop 047shifts (B2B SaaS)

Modern messaging for restaurant teams

Chat was unreliable and missing table stakes, so staff moved to other apps. Instead of one big redesign, I split the work into five releases that could each ship and be measured on their own.

+40%
increase in feature satisfaction, measured by a post-interaction survey

Product designer. Owned research through implementation across web and mobile, and mentored a junior designer on the mobile screens.

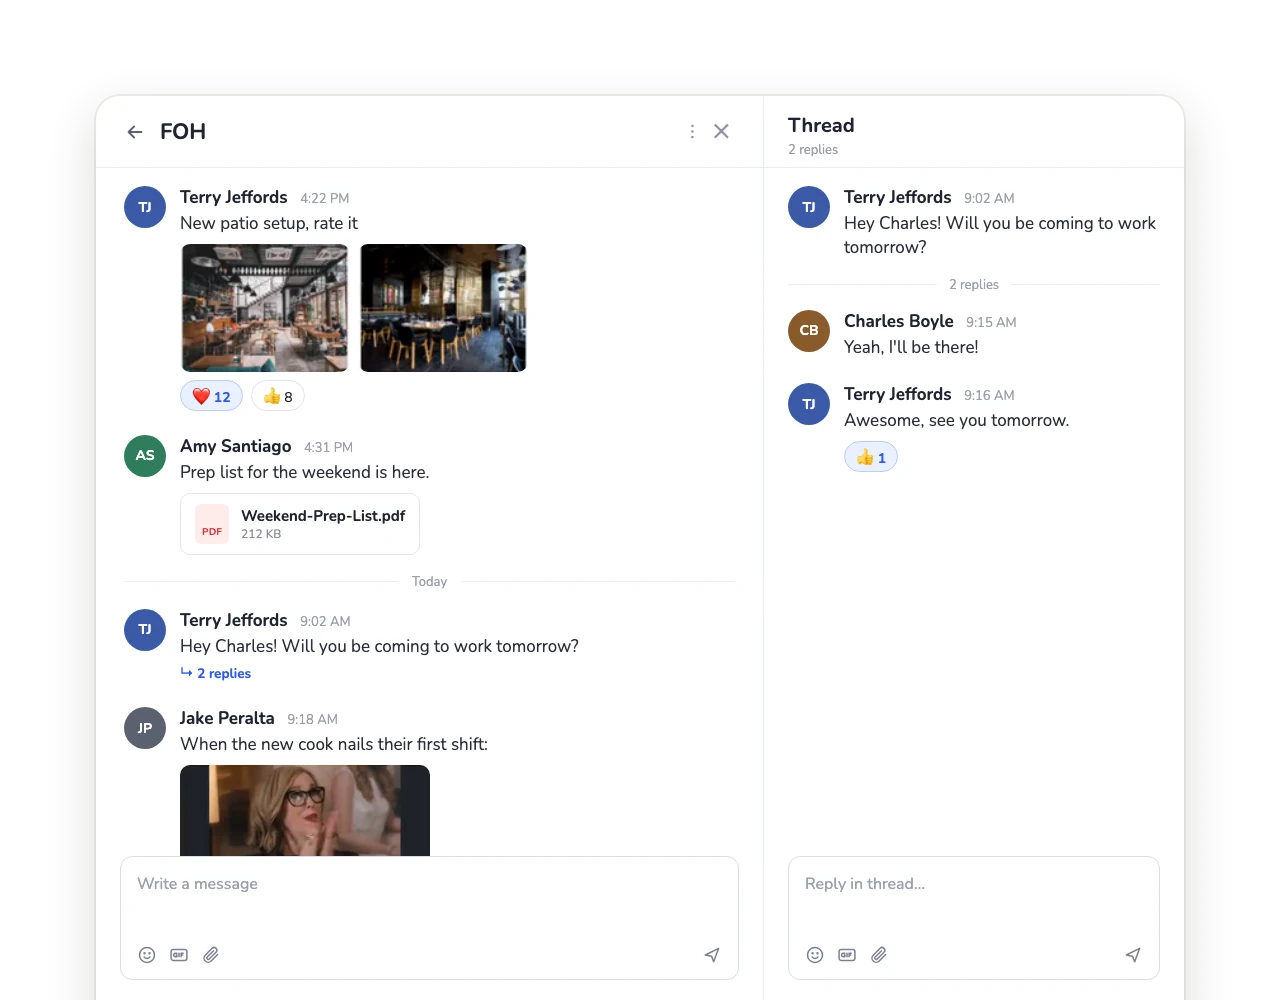
The modernized 7shifts conversation view with images, reactions, attachments, and a thread panel.
CBCharles Boyle replied in a threadYeah, I’ll be there!
Reactions

How I work

Have a strong point of view, hold it loosely, and let the evidence redirect you.

A lesson from travel, and the way I run a project
  1. 01

    Understand the problem

    I don’t start with screens. I start with the user, the business context, the constraints, and what we’re actually trying to change.

  2. 02

    Make ideas tangible

    Prototypes, flows, and experiments make ideas easy to discuss, test, and challenge.

  3. 03

    Design with the team

    The best solutions come from working closely with product, engineering, research, and customers.

  4. 04

    Measure and learn

    Shipping isn’t the end. I look at what happened, what we learned, and what should change next.

Portrait of Austin Milne
Austin Milne · Saskatchewan

About

A designer who started as a developer, and still thinks like one.

8+ years designing digital products across 0→1, core product, growth, and platform. I care about the outcome as much as the interface: what changed for the user, and what changed for the business.

My first startup role made me both designer and developer, and that technical curiosity stuck. Lately it means working closely with AI: using it to explore faster, test more ideas, and spend more of my time on judgment instead of production.

When I’m not designing, I’m usually planning the next trip.

More about me

Got a complex product problem? Let’s talk.

austinmilne8@gmail.com